Delhi’s Diwali AQI Reaches 376 in 2026, Third-Highest Since 2018
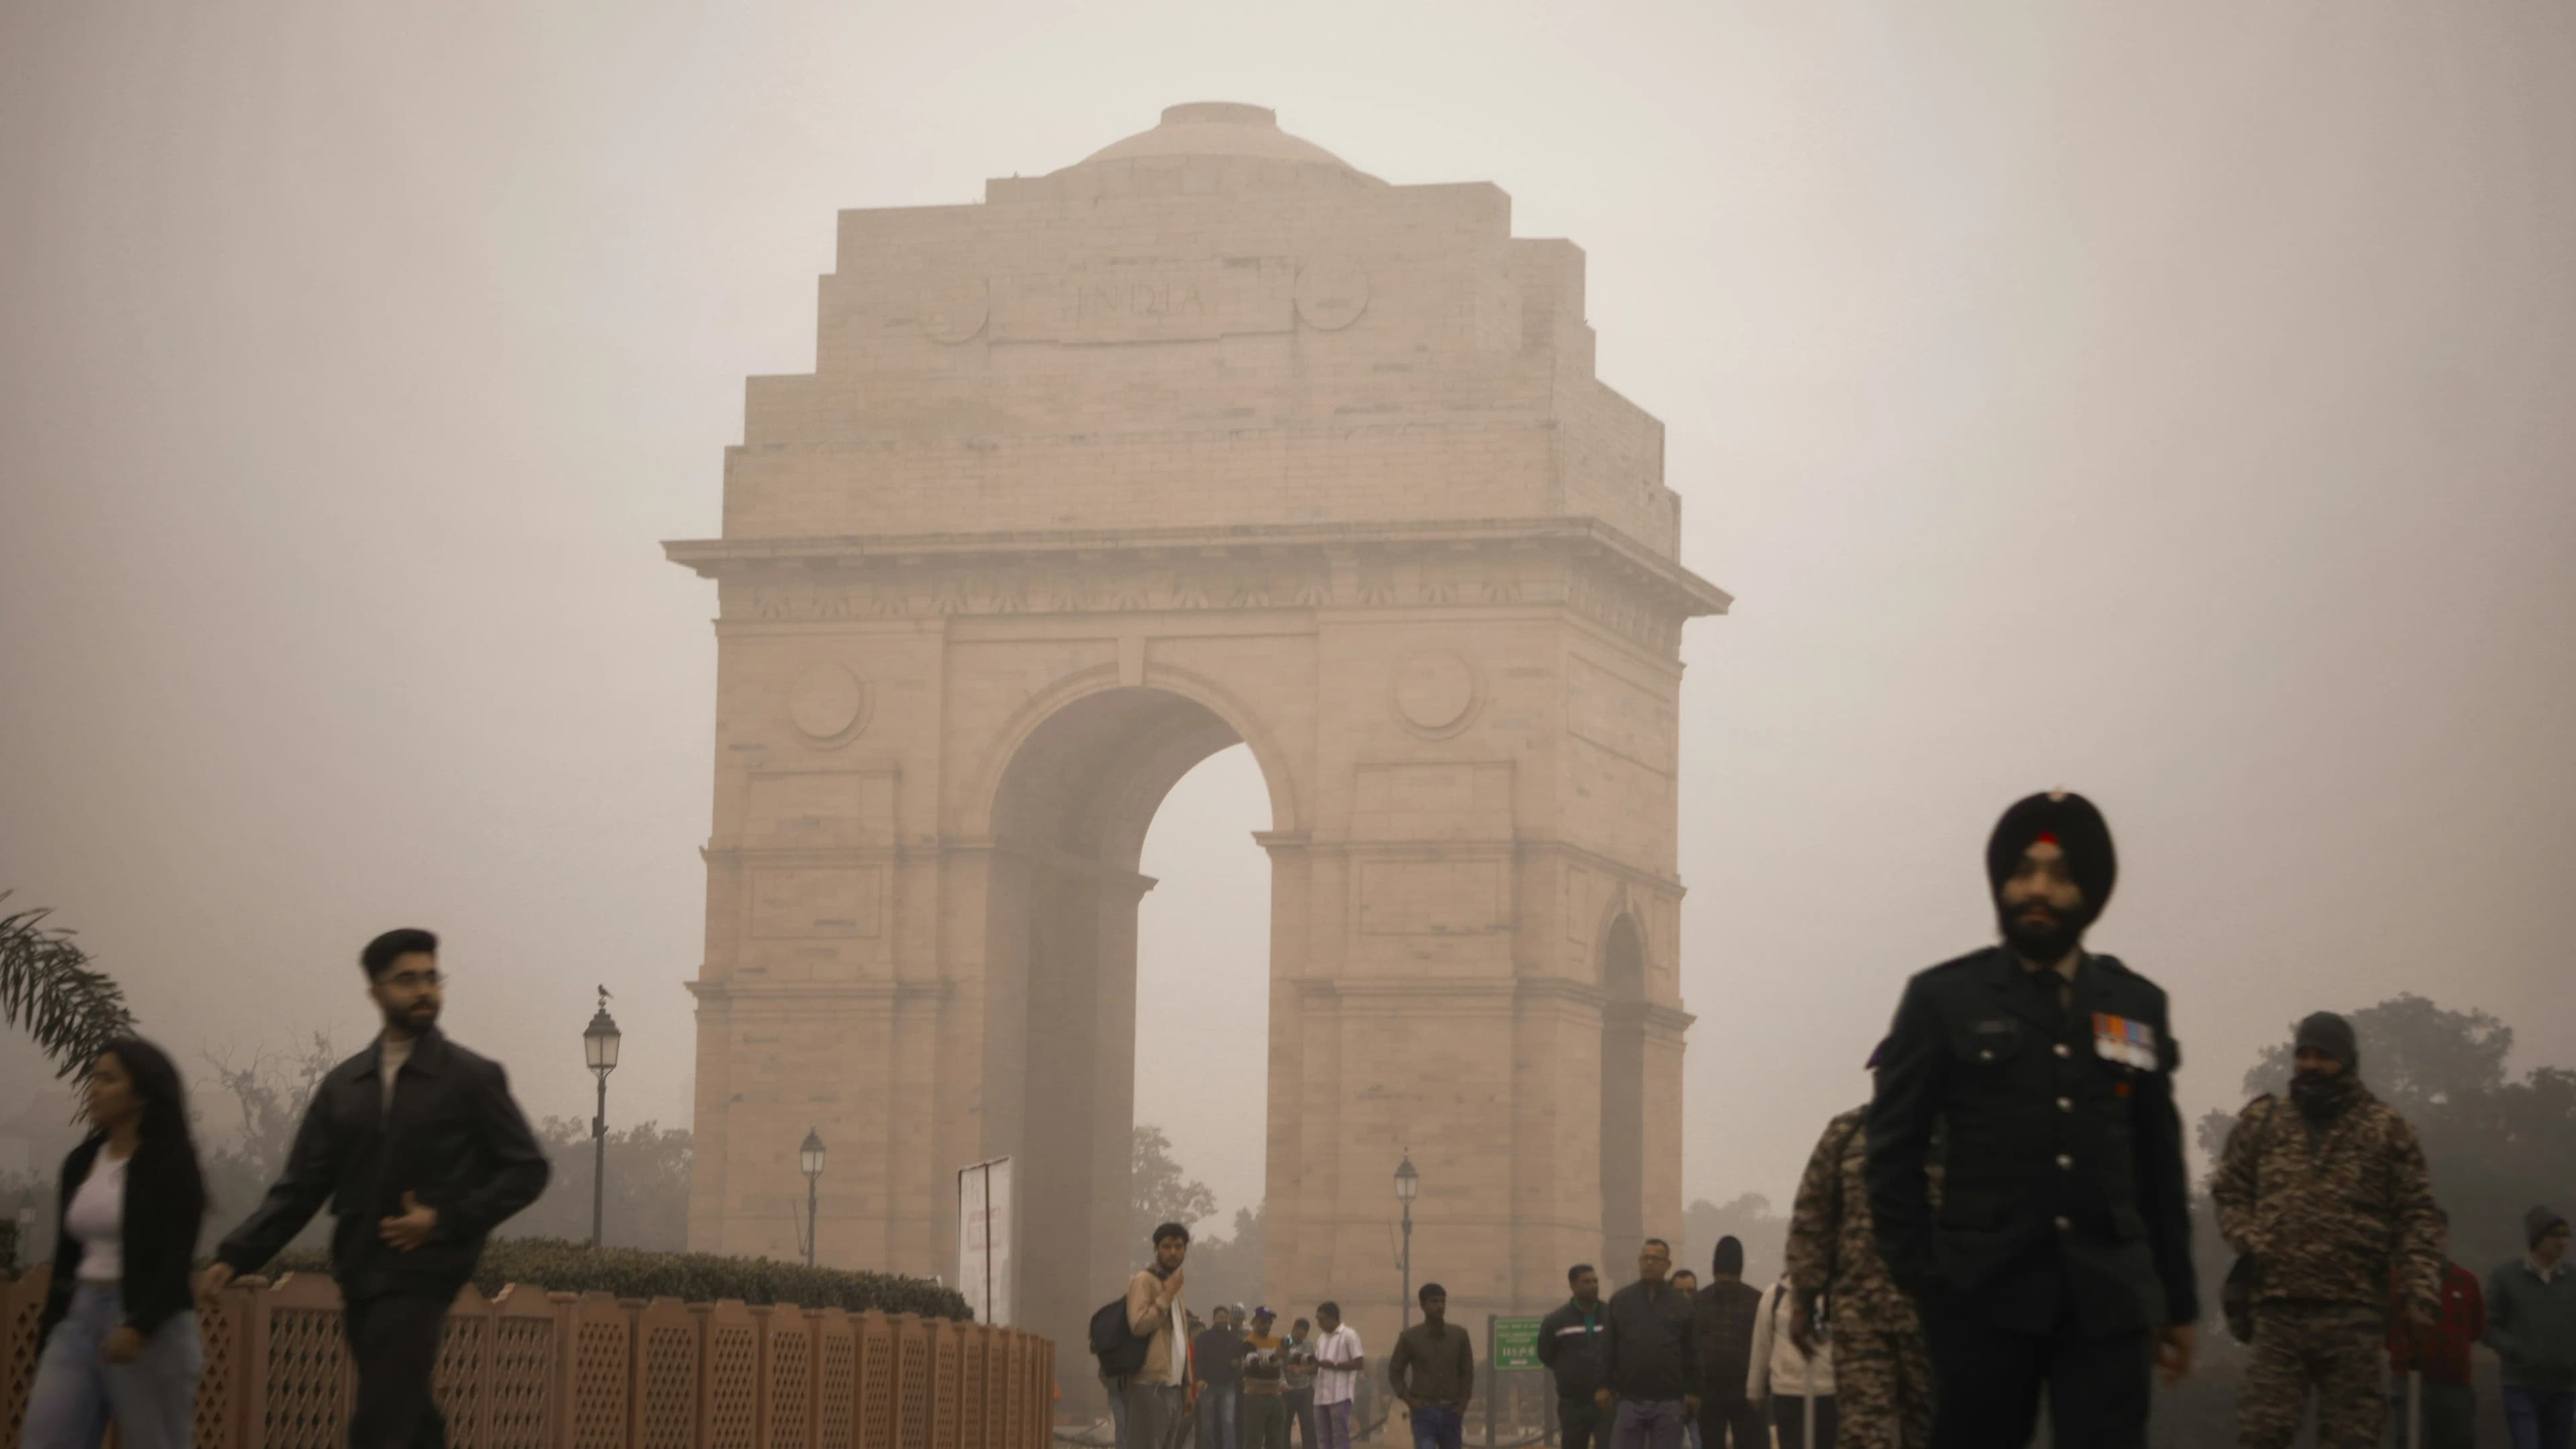
Pollution in Delhi Sky, India Gate in background · Image: Photo by Ashish Kushwaha on Unsplash
Delhi entered Diwali with its highest pre-festival AQI since 2018, indicating that the capital’s pollution crisis had intensified before the main celebrations began.
Published: 8 November 2026 | Updated through 4 pm IST
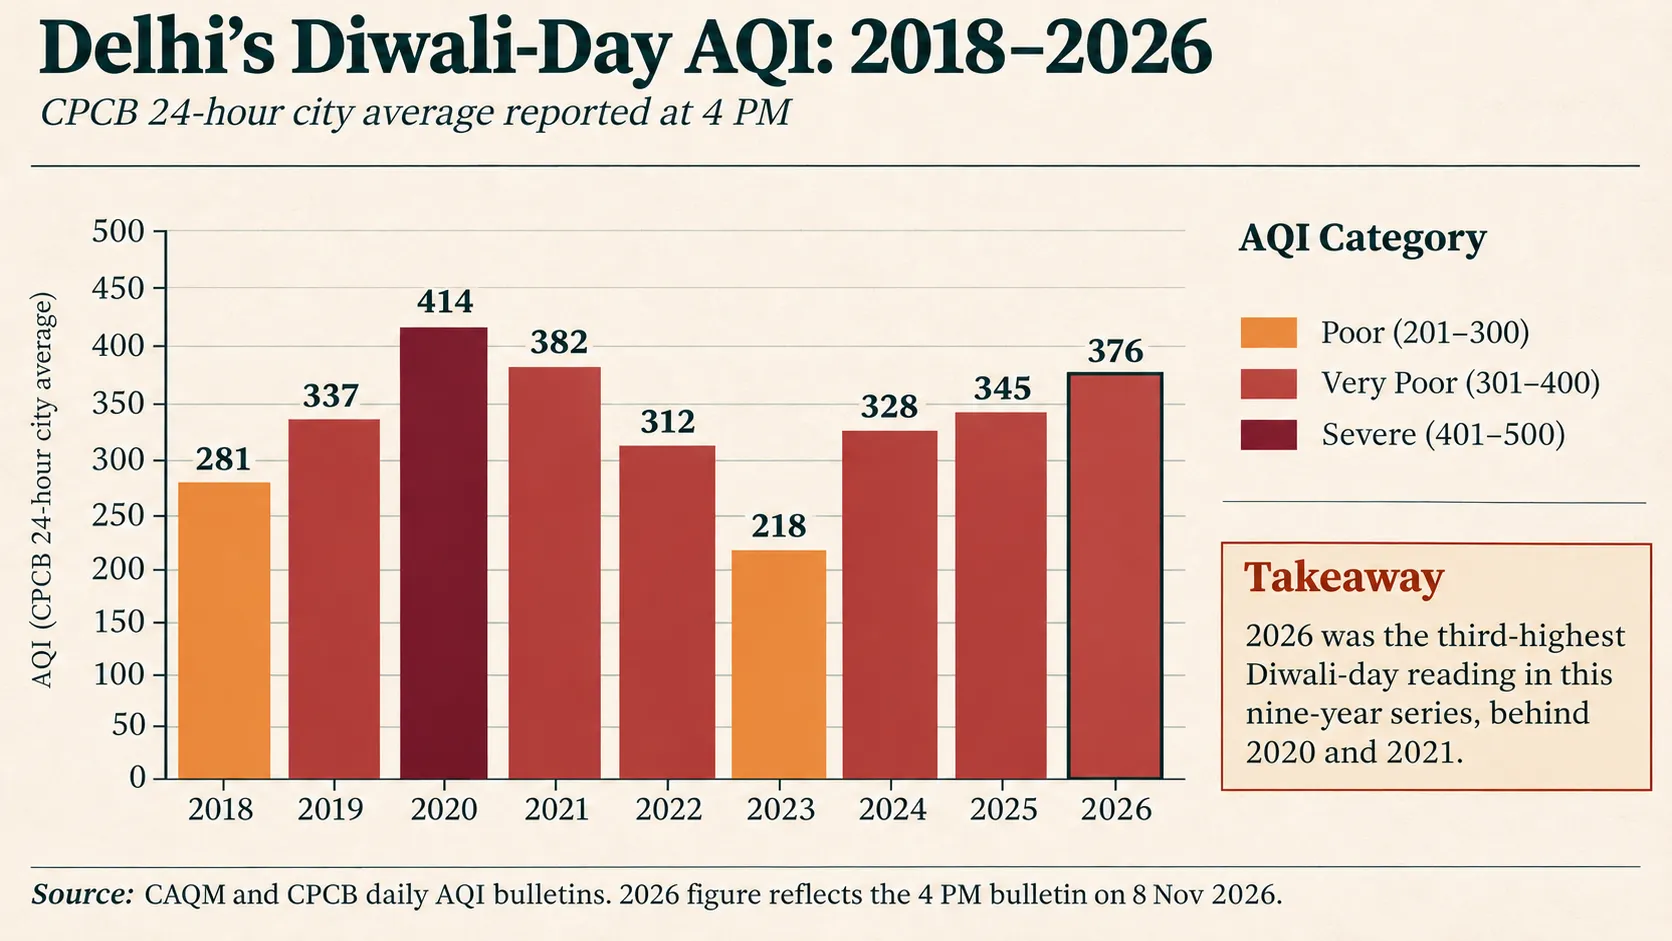
Delhi recorded a 24-hour average Air Quality Index of 376 on Diwali, 8 November 2026, placing the capital in the “very poor” category.
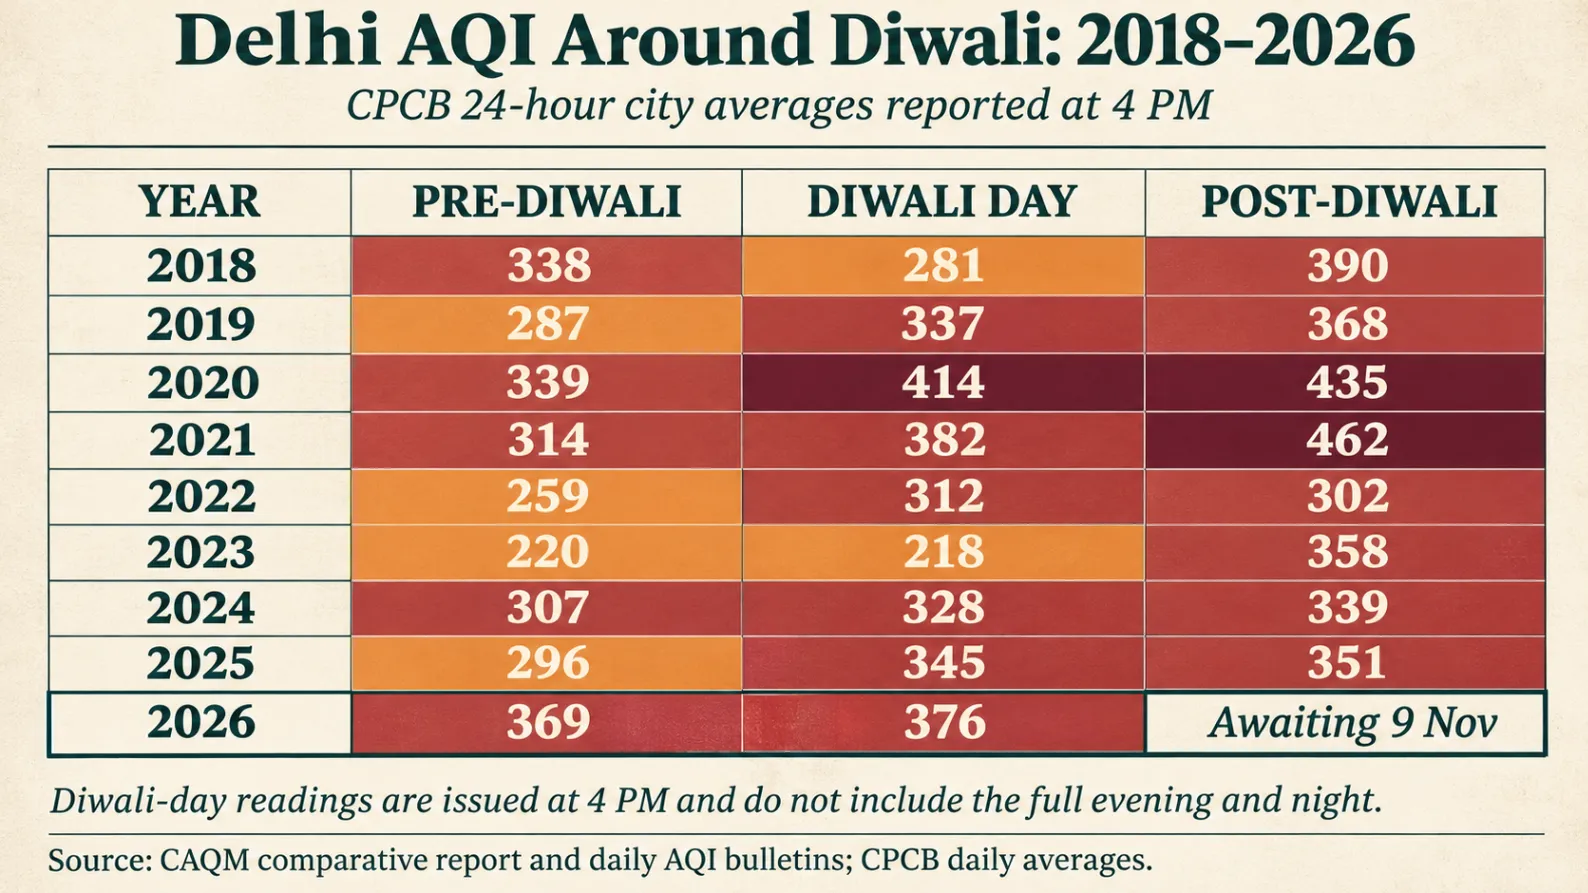
Within the nine-year period from 2018 to 2026, this was Delhi’s third-highest Diwali-day AQI. Only 2020, with an AQI of 414, and 2021, with 382, recorded higher readings.
The 376 figure was reported by PTI as Delhi’s average AQI for the day. The Times of India reported the same daily average.
Delhi’s air was already worse before Diwali
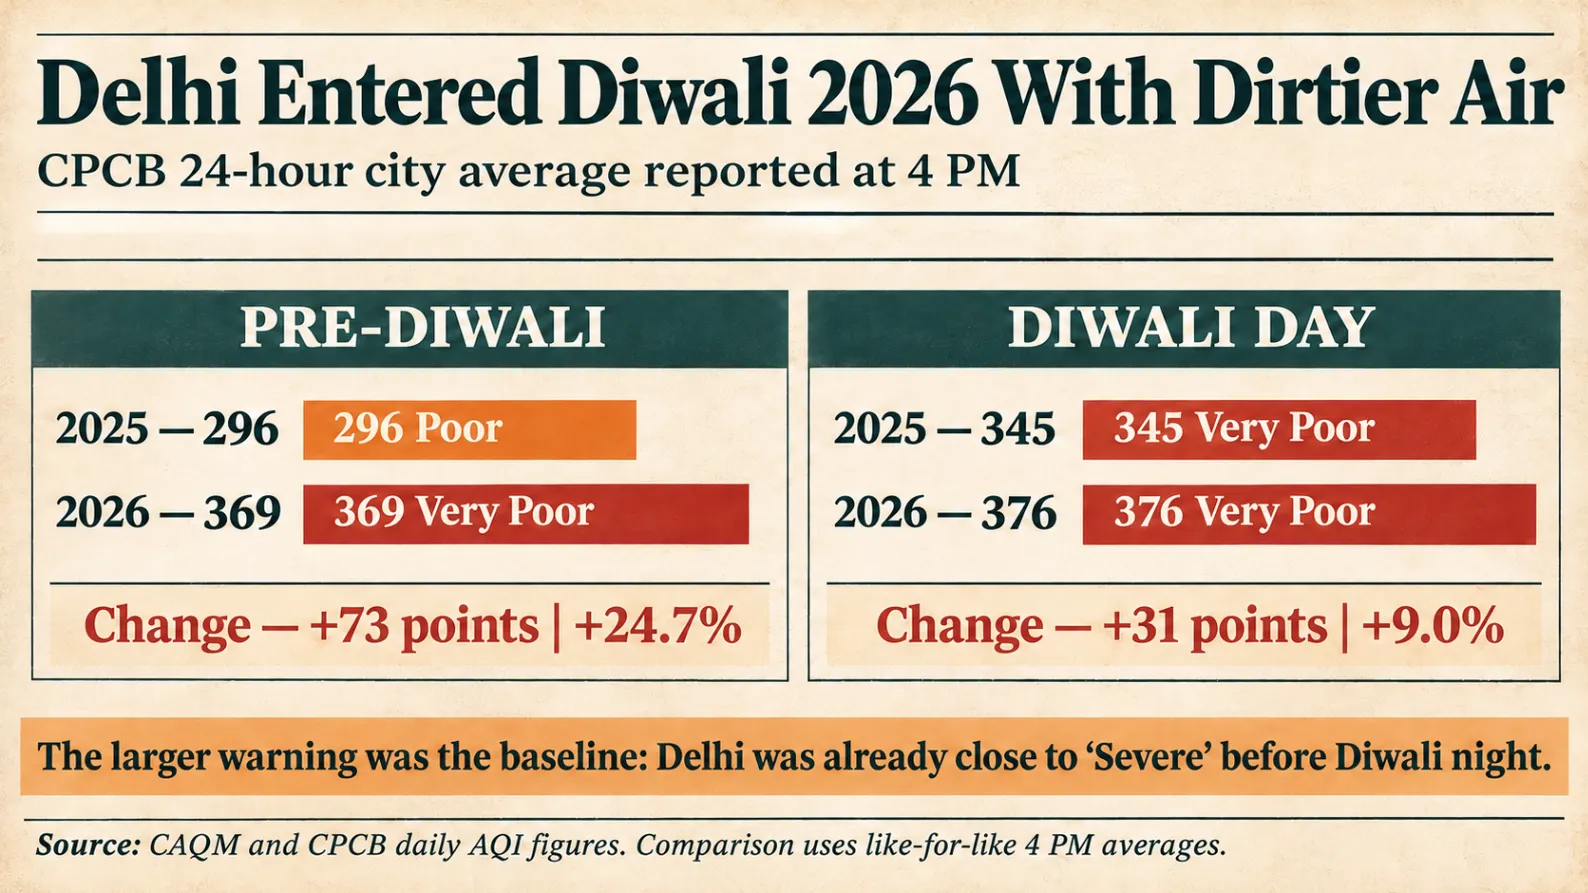
Delhi’s AQI stood at 369 on 7 November, the day before Diwali. This was the highest pre-Diwali reading in the 2018–2026 comparison.
In 2025, the corresponding pre-Diwali AQI was 296. The 2026 reading was therefore 73 points—or approximately 24.7%—higher.
On Diwali day, the AQI increased from 345 in 2025 to 376 in 2026, a rise of approximately 9%.
The comparison shows that Delhi did not move from clean air into the “very poor” category during Diwali night. Pollution was already close to the severe threshold of 401 before the main celebrations began.
Why was the 2023 reading much lower?
Delhi recorded a Diwali-day AQI of 218 in 2023, but the lower figure was strongly influenced by unusual weather.
Rain and thunderstorms associated with a western disturbance reached Delhi two days before Diwali. The rain removed some suspended particles, while stronger winds helped disperse accumulated pollution.
The improvement was temporary. Delhi’s AQI rose from 218 at 4 pm on Diwali to 358 the following day.
The timing also matters: CPCB’s daily Diwali figure is reported at 4 pm, before most evening firecracker activity. It does not represent the complete Diwali night.
The Delhi Pollution Control Committee’s assessment records the 2023 readings. The longer historical comparison is available in CAQM’s official report.
How AQI changed around previous Diwali celebrations
Historical data shows that Delhi’s AQI often rose on the day after Diwali, although the size of the increase varied considerably.
The highest post-Diwali reading in this comparison was 462 in 2021. The largest one-day increase occurred in 2023, when AQI rose from 218 to 358.
The post-Diwali figure for 2026 will become comparable after CPCB publishes its next 24-hour city average at 4 pm on 9 November.

Can the pollution be blamed only on firecrackers?
No. AQI measures the condition of the air; it does not determine how much pollution came from each source.
Firecrackers can produce a sharp, short-term increase in particulate matter. These emissions combine with pollution from vehicles, industries, road and construction dust, waste burning, agricultural fires and other regional sources.
Weather determines how quickly this pollution disperses. Calm winds and lower temperatures can trap pollutants close to the ground.
The figures therefore show that Delhi’s air was highly polluted around Diwali. They do not support attributing the entire AQI reading to one source.
What does AQI 376 mean?
An AQI between 301 and 400 is classified as very poor. To understand what each AQI category means- and why the GRAP stage in force may not always correspond directly with the reading displayed on a phone- read: AQI and GRAP Explained: What Delhi-NCR’s Air Quality Numbers and Restrictions Mean.
CPCB states that prolonged exposure may cause respiratory illness, with stronger effects among people with existing heart or lung conditions.
The National Centre for Disease Control recommends avoiding outdoor physical activity when air quality is very poor or severe. It also advises using a closely fitted N95 or N99 mask when going outside.
Data note: The “third-highest” description applies specifically to 2018–2026, not to all historical records. Figures for 2018–2023 come from CAQM’s official comparison. The 2024 figures and available 2025 figures come from individual CAQM bulletins. Remaining values are CPCB daily averages reported by established news organisations where a static government bulletin was unavailable.